
Quality Growth Strategy
Brookmont’s disciplined approach finds value, strength and growth through unique insights and analysis.
Brookmont Capital Management (“Brookmont”) is an employee-owned registered investment advisor whose investment strategy is based on a portfolio of individual equities that provide attractive current yields, potential dividend growth, and the opportunity for capital appreciation. They execute a top-down approach, beginning with a solid understanding of current economic and market cycles, and use their macroeconomic outlook in determining their asset allocation models, sector weightings, and seek to identify attractive areas of the market.
The Brookmont Equity Dividend Portfolio is a unit investment trust which invests in common stocks with above-average dividend yields and the potential for long-term capital gains. Not limited to a certain “style”, Brookmont selects stocks they believe offer attractive valuations with below-market risk profiles.
The Importance of Dividends
Dividends have historically been one of the few constants in the world of investing, and they have had a significant impact on stock performance, contributing nearly half of the stock market’s total return. According to Ibbotson Associates, dividends have provided approximately 41% of the 10.20% average annual total return on the S&P 500 Index from 1926 through 2019. Of course, past performance is no guarantee of future results.
Portfolio Objectives
This unit investment trust seeks above-average total return through a combination of capital appreciation and dividend income; however, there is no assurance the objective will be met.
Portfolio Selection Process
Determine Outlook For Economy & Market Cycle
This unit investment trust seeks above-average total return through a combination of capital appreciation and dividend income; however, there is no assurance the objective will be met.
Verify Company Is In Correct Sector
Once a given sector has been identifed, quantitative screens are used to reveal eligible securities. Screening criteria include current yield, frequency and degree of dividend increases, market capitalization, PEG ratio, credit rating and beta. The universe will normally include 175-200 companies.
Company Passes Quantitative Screens & Fundamental Analysis
Once quantitative thresholds have been met, companies undergo thorough fundamental analysis.
Equity Dividend Portfolio
In addition to traditional fundamental analysis, qualitative factors such as quality of management, brand, industry position and past execution are evaluated to create a complete view of a company before making a purchase decision.
The S&P 500 Index is an unmanaged index of 500 stocks used to measure large-cap U.S. stock market performance. The index cannot be purchased directly by investors.
Portfolio Summary
Initial Date of Deposit 12/1/2020
Initial Public Offering Price $10.00 per Unit
Portfolio Ending Date 3/1/2022
Historical 12-Mo Distribution Rate of Trust Holdings 2.10%
Historical 12-Month Distribution Per Unit* $0.2102
CUSIPs 30316Q 348(c) 355(r)
Fee Accounts CUSIPs 30316Q 363(c) 371(r)
Ticker Symbol FQUFTX
*There is no guarantee the issuers of the securities included in the trust will declare dividends or distributions in the future. The historical 12-month distribution per unit and historical 12-month distribution rate of the securities included in the trust are for illustrative purposes only and are not indicative of the trust’s distribution or distribution rate. Due to the negative economic impact across many industries caused by the recent COVID-19 outbreak, certain issuers of the securities included in the trust may elect to reduce the amount of dividends and/or distributions paid in the future. As a result, the “Historical 12-Month Distribution Rate of Trust Holdings,” which is based on the trailing twelvemonth distributions paid by the securities included in a trust, will likely be higher, and in some cases significantly higher, than the actual distribution rate achieved by the trust. The historical 12-month distribution per unit is based on the weighted average of the trailing 12-month distributions paid by the securities included in the portfolio. The historical 12-month distribution rate is calculated by dividing the historical 12-month distributions by the trust’s offering price. The historical 12-month distribution and rate are reduced to account for the effects of fees and expenses, which will be incurred when investing in a trust. Certain of the issuers may have reduced their dividends or distributions over the prior 12 months. The distribution per unit and rate paid by the trust may be higher or lower than the amount shown above due to certain factors that may include, but are not limited to, a change in the dividends or distributions paid by issuers, actual expenses incurred, or the sale of securities in the portfolio.
RISK CONSIDERATIONS | An investment in this unmanaged unit investment trust should be made with an understanding of the risks involved with owning common stocks, such as an economic recession and the possible deterioration of either the financial condition of the issuers of the equity securities or the general condition of the stock market. One of the securities held by the trust is issued by a real estate investment trust (REIT). Companies involved in the real estate industry are subject to changes in the real estate market, vacancy rates and competition, volatile interest rates and economic recession. An investment in a portfolio containing equity securities of foreign issuers is subject to additional risks, including currency fluctuations, political risks, withholding, the lack of adequate financial information, and exchange control restrictions impacting foreign issuers. Large capitalization companies may grow at a slower rate than the overall market. As the use of Internet technology has become more prevalent in the course of business, the trust has become more susceptible to potential operational risks through breaches in cybersecurity. The recent outbreak of a respiratory disease designated as COVID-19 was first detected in China in December 2019. The global economic impact of the COVID-19 outbreak is impossible to predict but is expected to disrupt manufacturing, supply chains and sales in affected areas and negatively impact global economic growth prospects. The COVID-19 outbreak has also caused significant volatility and declines in global financial markets, which have caused losses for investors. The impact of the COVID-19 outbreak may be short term or may last for an extended period of time, and in either case could result in a substantial economic downturn or recession. The value of the securities held by the trust may be subject to steep declines or increased volatility due to changes in performance or perception of the issuers. Although this portfolio terminates in approximately 15 months, the strategy is long-term. Investors should consider their ability to pursue investing in successive portfolios, if available. There may be tax consequences unless units are purchased in an IRA or other qualified plan.
38 Holdings (As of Day of Deposit)
TICKER COMPANY NAME PRICE*
COMMUNICATION SERVICES
CMCSA Comcast Corporation $50.24
DIS The Walt Disney Company $148.01
CONSUMER DISCRETIONARY
HD The Home Depot, Inc. $277.41
MCD McDonald’s Corporation $217.44
JWN Nordstrom, Inc. $25.92
SBUX Starbucks Corporation $98.02
CONSUMERSTAPLES
DEO Diageo Plc $154.95
SJM The J.M. Smucker Company $117.20
PEP PepsiCo, Inc. $144.23
PG The Procter & Gamble Company $138.87
UL Unilever Plc $61.06
ENERGY
CVX Chevron Corporation $87.18
COP ConocoPhillips $39.56
RDS/B Royal Dutch Shell Plc $32.45
FINANCIALS
BAC Bank of America Corporation $28.16
JPM JPMorgan Chase & Co. $117.88
PNC The PNC Financial Services Group, Inc. $138.07
USB U.S. Bancorp $43.21
WFC Wells Fargo & Company $27.35
HEALTHCARE
ABT Abbott Laboratories $108.22
JNJ Johnson & Johnson $144.68
MDT Medtronic Plc $113.70
MRK Merck & Co., Inc. $80.39
NVS Novartis AG $90.83
INDUSTRIALS
HON Honeywell International Inc. $203.92
LHX L3Harris Technologies Inc. $191.99
ROP Roper Technologies, Inc. $427.00
UPS United Parcel Service, Inc. $171.07
INFORMATION TECHNOLOGY
ACN Accenture Plc $249.09
ADI Analog Devices, Inc. $139.08
AAPL Apple Inc. $119.05
AVGO Broadcom Inc. $401.58
MSFT Microsoft Corporation $214.07
NVDA NVIDIA Corporation $536.06
MATERIALS
DD DuPont de Nemours Inc. $63.44
REAL ESTATE
CCI Crown Castle International Corp. $167.57
UTILITIES
SRE Sempra Energy $127.48
SO The Southern Company $59.85
*As of the close of business on 11/30/20. Market values are for reference only and are not indicative of your individual cost basis.
Sales Charges (Based on $10 Public Offering Price)
Standard Accounts
Transactional Sales Charges Initial 0.00%
Deferred 1.35%
Creation & Development Fee 0.50%
Maximum Sales Charge 1.85%
Fee/Wrap Accounts
Maximum Sales Charges 0.50%
The deferred sales charge will be deducted in three monthly installments commencing 3/19/21.
When the public offering price is less than or equal to $10.00 per unit, there will be no initial sales charge. If the price exceeds $10.00 per unit, you will pay an initial sales charge.
The maximum sales charge for investors in fee accounts consists of the creation and development fee. Investors in fee accounts are not assessed any transactional sales charges. Standard accounts sales charges apply to units purchased as an ineligible asset.
The creation and development fee is a charge of $0.050 per unit collected at the end of the initial offering period. If the price you pay exceeds $10.00 per unit, the creation and development fee will be less than 0.50%; if the price you pay is less than $10.00 per unit, the creation and development fee will exceed 0.50%.
In addition to the sales charges listed, UITs are subject to annual operating expenses and organization costs.
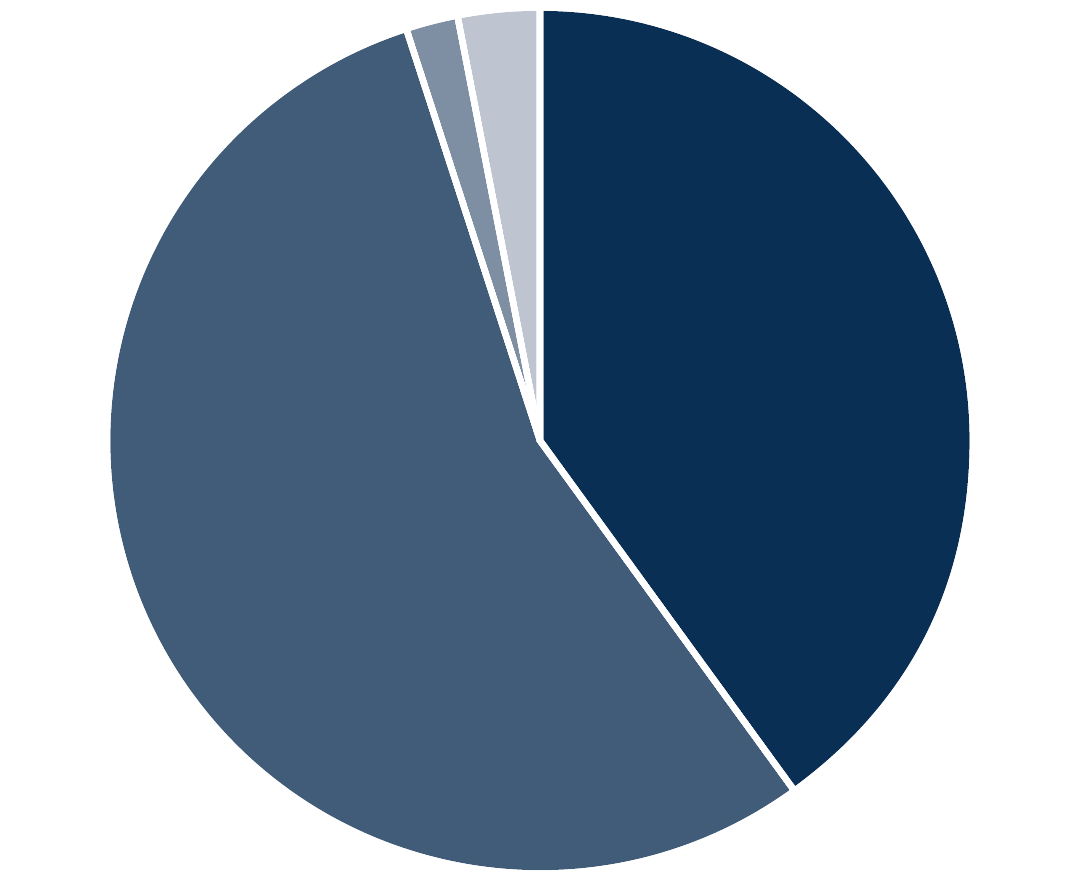
Holdings Styles Analysis
- Large-Cap Growth 40.22%
- Large-Cap Value 54.79%
- Mid-Cap Growth 1.99%
- Mid-Cap Value 3.00%
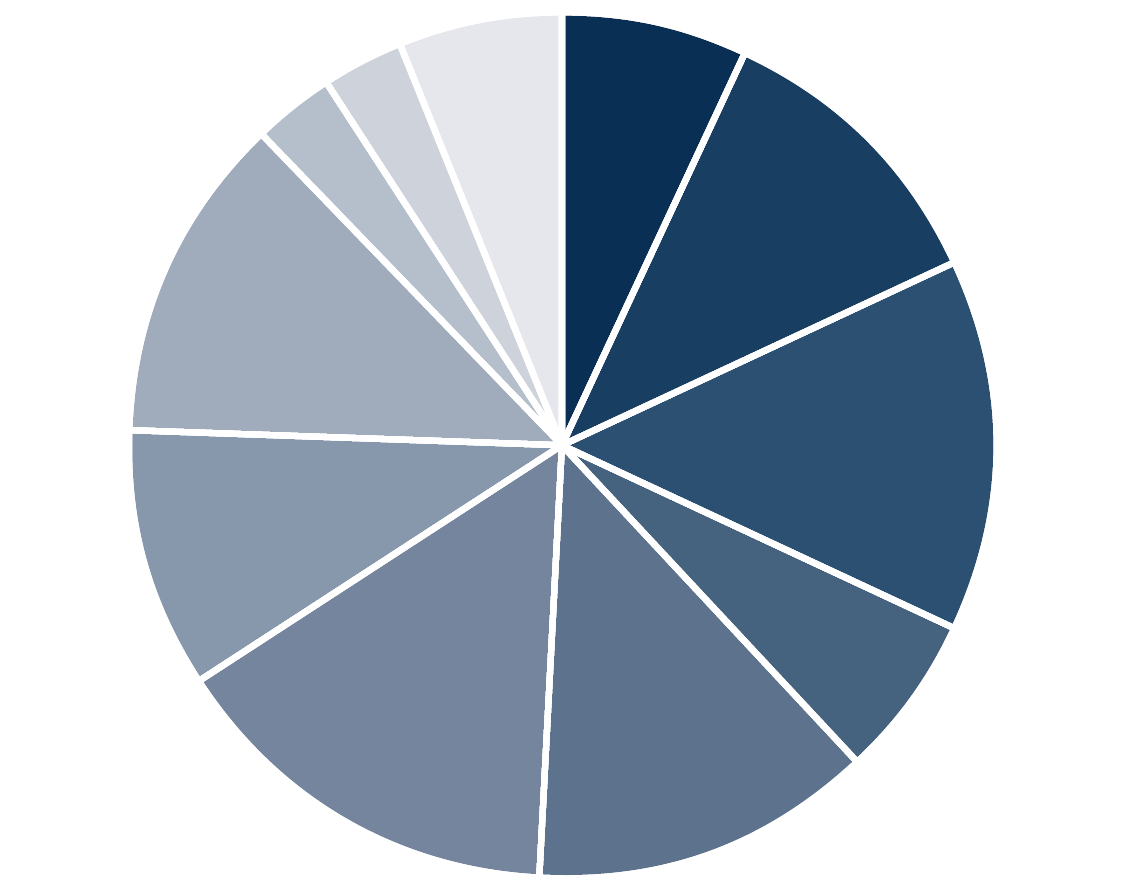
Holdings Styles Analysis
- Communication Services 7.02%
- Consumer Discretionary 11.06%
- Consumer Staples 13.99%
- Energy 6.01%
- Financials 13.02%
- Health Care 14.90%
- Industrials 9.78%
- Information Technology 12.19%
- Materials 3.01%
- Real Estate 3.01%
- Utilities 6.01%
Holdings Composition
U.S. Stocks 84.97%
Non-U.S. Stocks 15.03%
The holdings characteristics of the portfolio are determined as of the initial date of deposit and may differ slightly from those indicated above due to the requirement that only whole shares be purchased for the portfolio and will likely vary thereafter due to market fluctuations in the underlying securities. For a complete description of these characteristics refer to the prospectus.
You should consider the portfolio’s investment objective, risks, and charges and expenses carefully before investing. Contact your financial professional or call First Trust Portfolios L.P. at 1-800-621-1675 to request a prospectus, which contains this and other information about the portfolio. Read it carefully before you invest.
The information presented is not intended to constitute an investment recommendation for, or advice to, any specific person. By providing this information, First Trust is not undertaking to give advice in any fiduciary capacity within the meaning of ERISA, the Internal Revenue Code or any other regulatory framework. Financial professionals are responsible for evaluating investment risks independently and for exercising independent judgment in determining whether investments are appropriate for their clients.
Our products are available through institutions and select advisory platforms.
Request a Meeting
